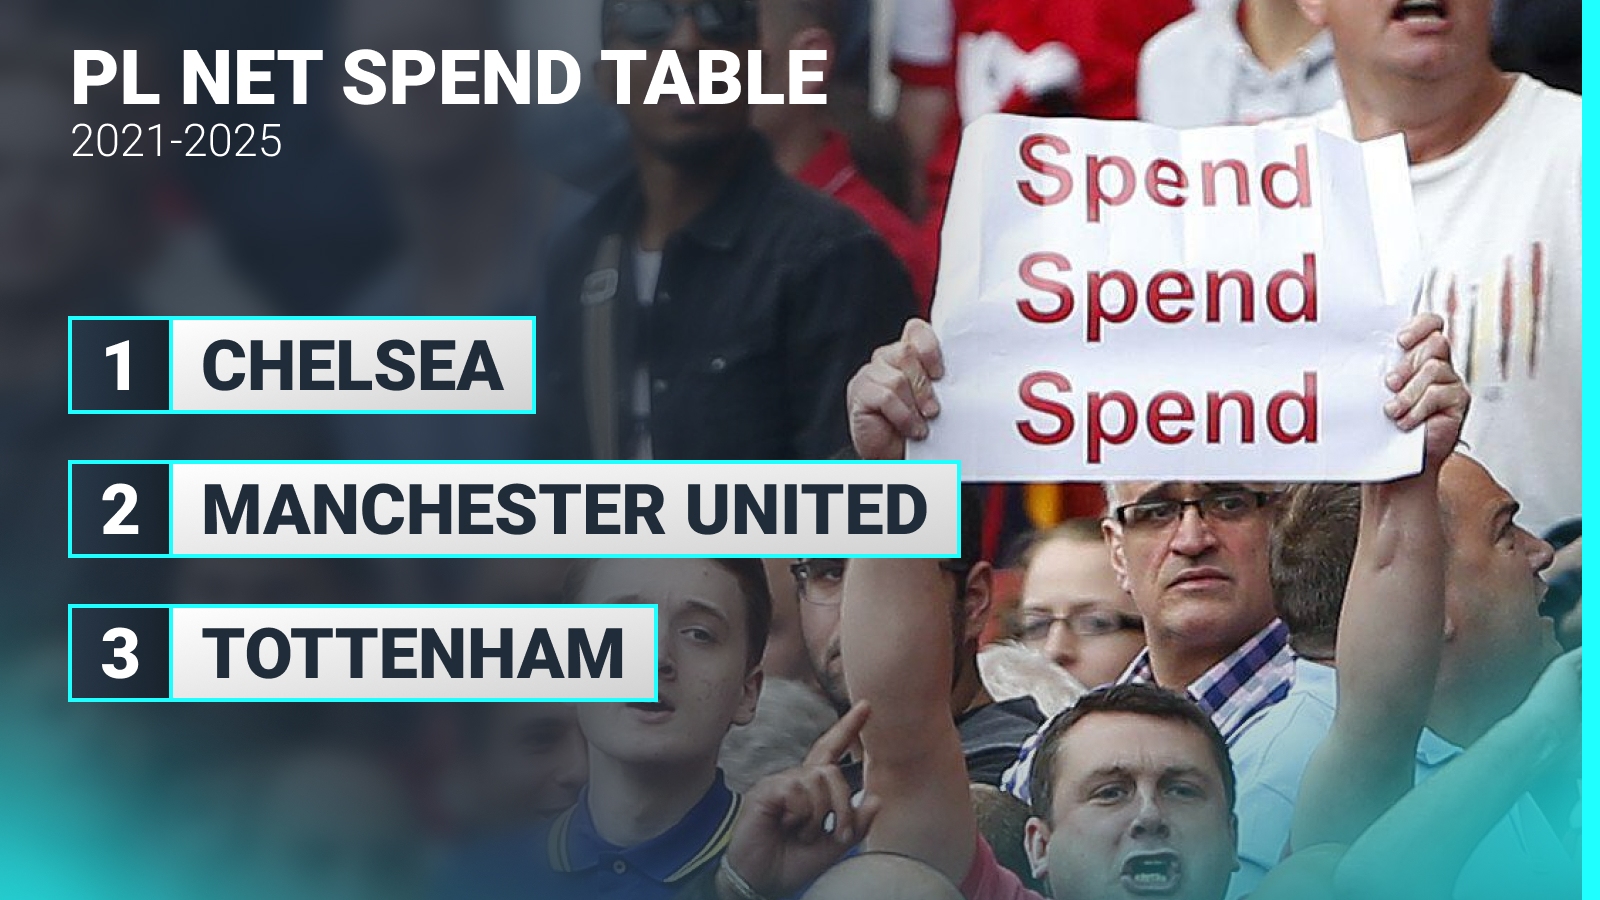
Forget the league table, we know it’s all about the Premier League net spend table! We take transfers from the summer of 2021 until the present day.
Bold denotes a profit; final league positions in brackets…
1) Chelsea five-year net spend: £-720.23m
25/26: £ -90.74m
24/25: £-33.76m (4th)
23/24: £-153.68m (6th)
22/23: £ -473.95M (12th)
21/22: £31.16m (3rd)
READ: Chelsea dominate 10 biggest transfer window spends ever
2) Manchester United five-year net spend: £-590.25m
25/26: £ -62.5m
24/25: £-117.79m (15th)
23/24: £ -119.33M (8th)
22/23: £-182.05m (3rd)
21/22: £ -91.93M (6th)
3) Tottenham five-year net spend: £-463m
25/26: £-49.15m
24/25: £-91.42m (17th)
23/24: £ -125.5m (5th)
22/23: £-117m (8th)
21/22: £-50.8m (4th)
4) Arsenal five-year net spend: £-410.78m
25/26: £6.81m
24/25: £-20.81m (2nd)
23/24: £ -137.52M (2nd)
22/23: £ -134.78m (2nd)
21/22: £ -112.73M (5th)
5) Liverpool five-year net spend: £-361.32m
25/26: £ -186.5M
24/25: £29.14m (Champions)
23/24: £ -92.26M (3RD)
22/23: £ -53.96M (5th)
21/22: £-50.02m (2nd)
6) Manchester City five-year net spend: £-313.64m
25/26: £ -90.4m
24/25: £ -84.73M (3RD)
23/24: £-114.47m (Champions)
22/23: £5.94m (Champions)
21/22: £-37.38m (Champions)
7) Newcastle United five-year net spend: £-313.35m
25/26: £ 14.4m
24/25: £ -17.73M (5th)
23/24: £ -85.79M (7th)
22/23: £-141.69m (4th)
21/22: £-108.17m (11th)
8) West Ham United five-year net spend: £-299.9m
25/26: £ -35.4m
24/25: £-82.6m (14th)
23/24: £21.47m (9th)
22/23: £-145.1m (14th)
21/22: £-58.25m (7th)
9) Nottingham Forest five-year net spend: £-211.83m
25/26: £ 8.95m
24/25: £-15.58m (7th)
23/24: £-37.2m (17th)
22/23: £-160.27m (16th)
21/22: £-5.07m (4th in Championship)
READ: The 20 biggest transfers in the world in the 2025 summer transfer window
10) Brentford five-year net spend: £-165.8m
25/26: £-22.05m
24/25: £-20.12m (10th)
23/24: £ -52.3M (16th)
22/23: £-38.44m (9th)
21/22: £ -31.33M (13th)
11) Crystal Palace five-year net spend: £-158.14m
25/26:
24/25: £7.45m (12th)
23/24: £ -56.2M (10th)
22/23: £-34.11m (11th)
21/22: £ -70.97m (12th)
12) Bournemouth five-year net spend: £-138.73m
25/26: £ 87.34m
24/25: £ -49.67m (9th)
23/24: £-104.27m (12th)
22/23: £-68.88m (15th)
21/22: £10.08m (2nd in Championship)
13) Brighton five-year net spend: £-104.59m
25/26: £-50.11m
24/25: £-191.58m (8th)
23/24: £69.1m (11th)
22/23: £ 70.82m (6th)
21/22: 3.25M (9th)
14) Fulham five-year net spend: £-91.64m
25/26:
24/25: £-18.86m (11th)
23/24: £-16.55m (13th)
22/23: £-42.03m (10th)
21/22: £-13.1m (1st in Championship)
15) Aston Villa five-year net spend: £-87.4m
25/26: £ -5.9m
24/25: £39.54m (6th)
23/24: £-65.44m (4th)
22/23: £-38.25m (7th)
21/22: £-2.32m (14th)
16) Burnley five-year net spend: £-57.89m
25/26: £ -34.5m
24/25: £46.2m (2nd in Championship)
23/24: £-90M (19th)
22/23: £28.03m (1st in Championship)
21/22: £-7.47m (18th)
17) Leeds United five-year net spend: £6.39m
25/26: £-10.26m
24/25: £109.47m (1st in Championship)
23/24: £-1.95m (3rd in Championship)
22/23: £ -41.44m (19th)
21/22: £-49.75m (17th)
18) Sunderland five-year net spend: £15.12m
25/26: £16.46m
24/25: £5.41m (4th in Championship)
23/24: £-1.54m (16th in Championship)
22/23: £5.08m (6th in Championship)
21/22: £-0.2m (5th in League One)
19) Wolves five-year net spend: £27.86m
25/26: £ 75.3M
24/25: £ -8.9m (16th)
23/24: £64.14m (14th)
22/23: £-97.64m (13th)
21/22: £ –4.96m (10th)
20) Everton five-year net spend: £77.7m
25/26: £-9.27m
24/25: £28.17m (13th)
23/24: £36.23m (15th)
22/23: £ 21.7m (17th)
21/22: £5.56m (16th)


